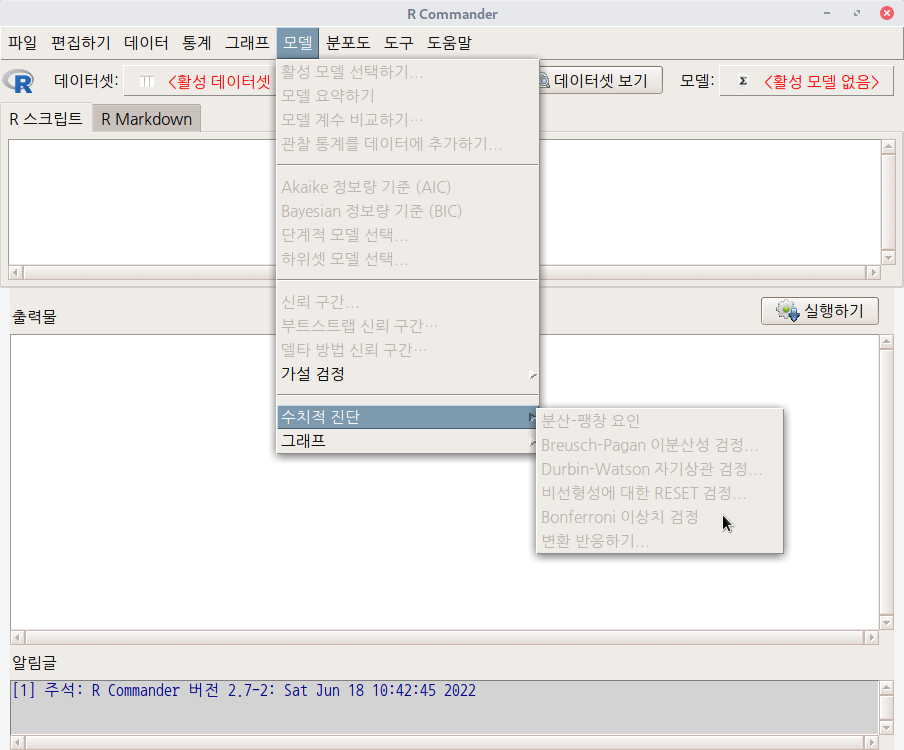
모델 > 수치적 진단 > Bonferroni 이상치 검정
Models > Numeric diagnostics > Bonferroni outlier test
변수들의 조합으로 어느 모형을 만들었을 때, 일반적으로 그 모형은 제한된 설명력의 범위를 갖는다. '모델 > Bonferroni 이상치 검정' 기법은 어느 사례가 모형의 수리적 설명 범위 밖에 있는지를 찾는 방법이다.
carData 패키지에 있는 Prestige 데이터셋을 이용하여 연습해보자.
Prestige 데이터셋
carData > Prestige data(Prestige, package="carData") help("Prestige") Prestige {carData} R Documentation Prestige of Canadian Occupations Description The Prestige data frame has 102 rows and 6 col..
rcmdr.kr
아래와 같이 Prestige 데이터셋을 불러오고, LinearModel.1을 만들고, outlierTest를 해보자.
data(Prestige)
LinearModel.1 <- lm(prestige ~ education + income, data=Prestige)
summary(LinearModel.1)
outlierTest(LinearModel.1)
1) 먼저, '데이터 > 패키지에 있는 데이터 > 첨부된 패키지에서 데이터셋 읽기...' 메뉴 기능을 통하여 carData패키지에서 Prestige 데이터셋을 선택하고, 예(OK) 버튼을 누른다. Prestige 데이터셋이 활성화될 것이다.
2) '통계 > 적합성 모델 > 선형 모델...'메뉴 기능을 열고, 'prestige ~ education + income'의 회귀식을 입력한다. 그러면, LinearModel.1의 선형 모형 요약정보가 화면에 출력될 것이다.
3) '모델 > Bonferroni 이상치 검정'메뉴 기능을 선택하면, 출력물을 생산한다.


newsboys라는 이름을 가진 사례가 LinearModel.1의 모형식으로 설명력으로 보면 이상치에 해당된다는 의미가 된다. 여러개의 모형을 추가로 만들고, 'Bonferroni 이상치 검정'을 차례로 해보자.
data(Prestige)
LinearModel.1 <- lm(prestige ~ education + income, data=Prestige)
summary(LinearModel.1)
outlierTest(LinearModel.1)
LinearModel.2 <- lm(prestige ~ education + income + education:income, data=Prestige)
LinearModel.3 <- lm(prestige ~ education + log(income), data=Prestige)
LinearModel.4 <- lm(prestige ~ education + income + type, data=Prestige)
outlierTest(LinearModel.1)
outlierTest(LinearModel.2)
outlierTest(LinearModel.3)
outlierTest(LinearModel.4)
LinearModel.2, LinearModel.3, LinearModel4 등을 위와 같이 만들었을때, 어떤 이상치가 발견될까.

LinearModel.2와 LinearModel.3는 farmers를, LinearModel.4는 medical.technicians를 이상치로 발견한다.
'Models > Numerical diagnostics' 카테고리의 다른 글
| 3. Durbin-Watson test for autocorrelation... (0) | 2022.06.21 |
|---|---|
| 4. RESET test for nonlinearity... (0) | 2022.06.20 |
| 6. Response transformation... (0) | 2022.06.20 |
| 1. Variance-inflation factors (0) | 2022.06.14 |